편차는 기본 데이터가 평균으로부터 얼마나 떨어져 있는지에 대해 나타냅니다.
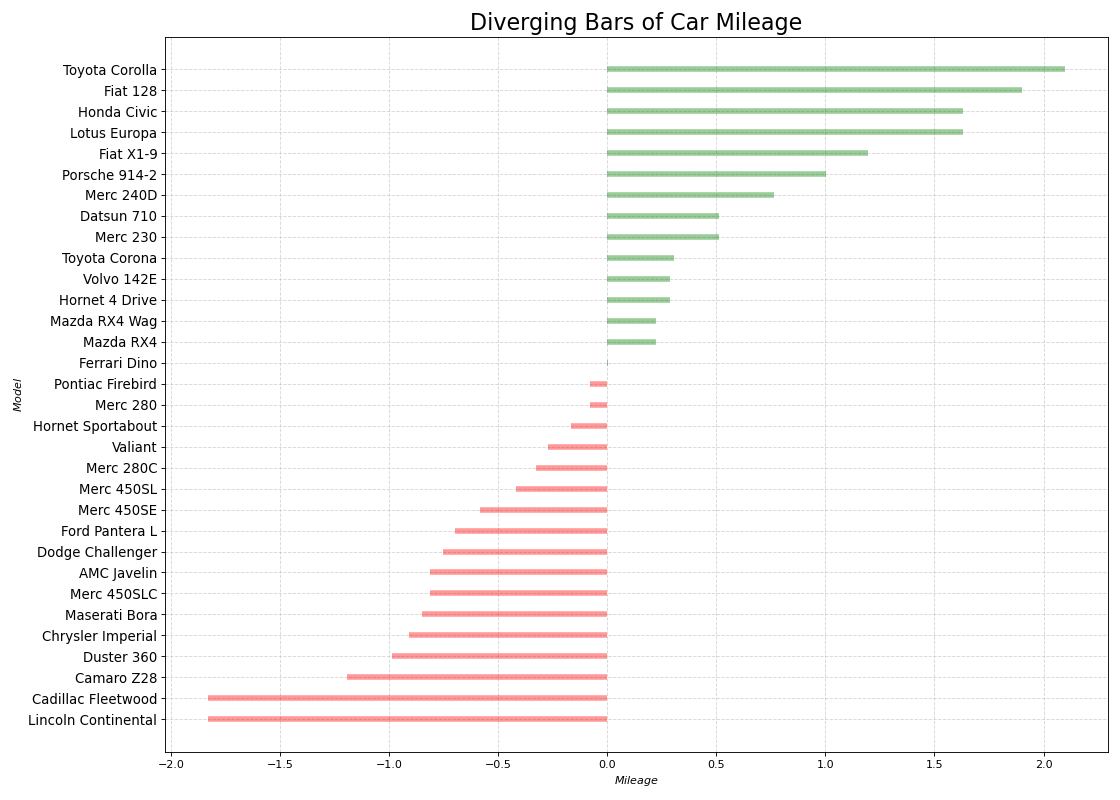
편차 막대는 단일 메트릭을 기반으로 항목이 어떻게 변하는지 확인하고 변동의 순서와 양을 시각화하려는 경우 사용됩니다. 데이터에서 그룹의 성능을 빠르게 구별하는 데 도움이 되며 매우 직관적이며 즉시 요점을 전달할 수 있습니다.
# 라이브러리 불러오기
import pandas as pd
import matplotlib.pyplot as plt

# 데이터 가져오기 및 전처리
df = pd.read_csv("https://github.com/selva86/datasets/raw/master/mtcars.csv")
x = df.loc[:, ['mpg']]
df['mpg_z'] = (x - x.mean())/x.std()
df['colors'] = ['red' if x < 0 else 'green' for x in df['mpg_z']]
df.sort_values('mpg_z', inplace=True)
df.reset_index(inplace=True)

# 그래프 그리기
plt.figure(figsize=(14,10), dpi= 80)
plt.hlines(y=df.index, xmin=0, xmax=df.mpg_z, color=df.colors, alpha=0.4, linewidth=5)

# 그래프 꾸미기
plt.gca().set(ylabel='$Model$', xlabel='$Mileage$')
plt.yticks(df.index, df.cars, fontsize=12)
plt.title('Diverging Bars of Car Mileage', fontdict={'size':20})
plt.grid(linestyle='--', alpha=0.5)
plt.tight_layout()
plt.savefig('diversing_bar.png')

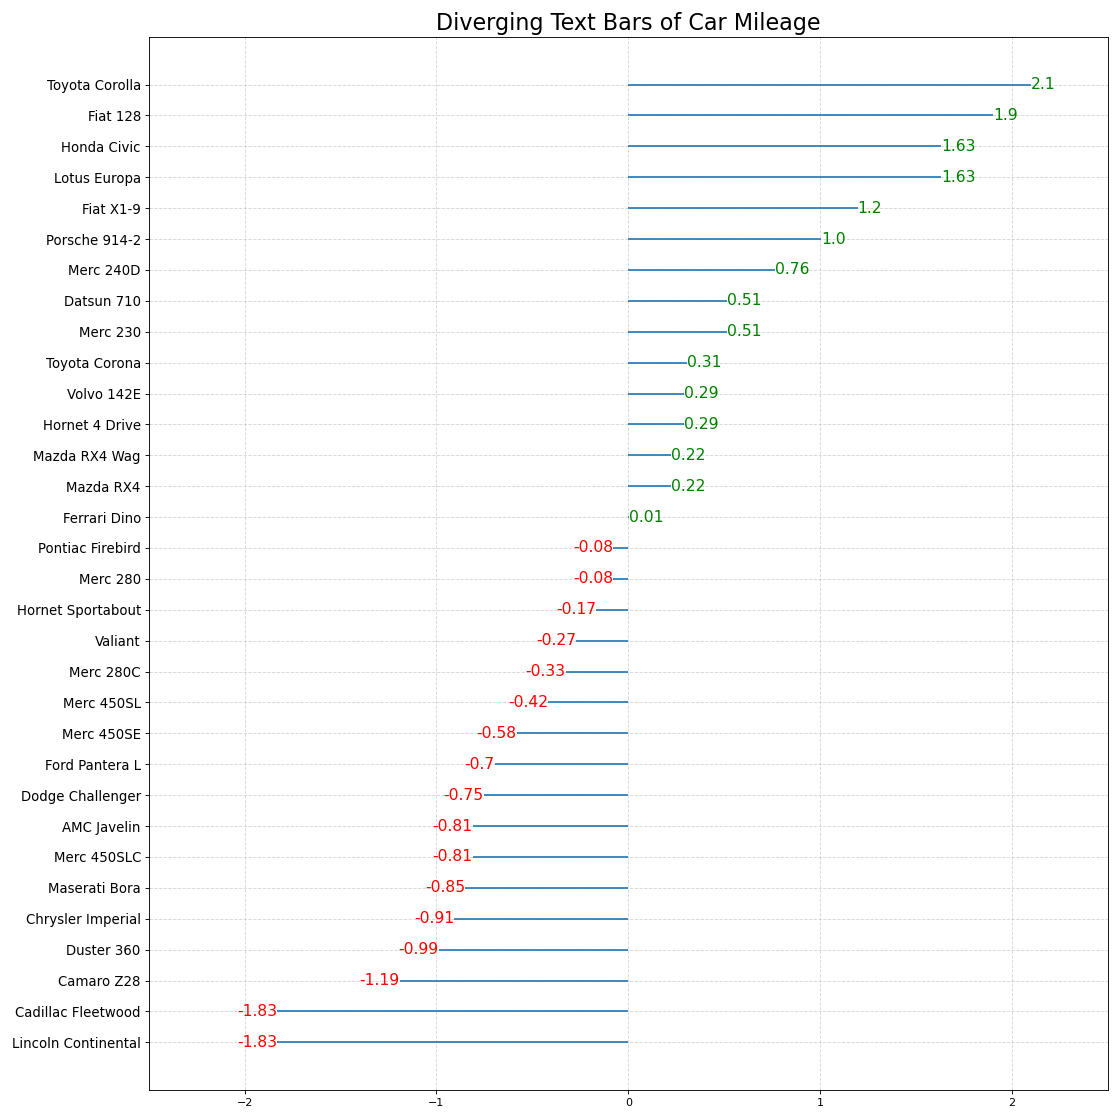
차트 내 각 항목의 값을 멋지고 보기 좋은 방식으로 표시하려는 경우 사용됩니다.
# 라이브러리 불러오기
import pandas as pd
import matplotlib.pyplot as plt

# 데이터 가져오기 및 전처리
df = pd.read_csv("https://github.com/selva86/datasets/raw/master/mtcars.csv")
x = df.loc[:, ['mpg']]
df['mpg_z'] = (x - x.mean())/x.std()
df['colors'] = ['red' if x < 0 else 'green' for x in df['mpg_z']]
df.sort_values('mpg_z', inplace=True)
df.reset_index(inplace=True)

# 그래프 그리기
plt.figure(figsize=(14,14), dpi= 80)
plt.hlines(y=df.index, xmin=0, xmax=df.mpg_z)
for x, y, tex in zip(df.mpg_z, df.index, df.mpg_z):
    t = plt.text(x, y, round(tex, 2), horizontalalignment='right' if x < 0 else 'left',
                verticalalignment='center', fontdict={'color':'red' if x < 0 else 'green', 'size':14})

# 그래프 꾸미기
plt.yticks(df.index, df.cars, fontsize=12)
plt.title('Diverging Text Bars of Car Mileage', fontdict={'size':20})
plt.grid(linestyle='--', alpha=0.5)
plt.xlim(-2.5, 2.5)
plt.tight_layout()
plt.savefig('diversing_text.png')

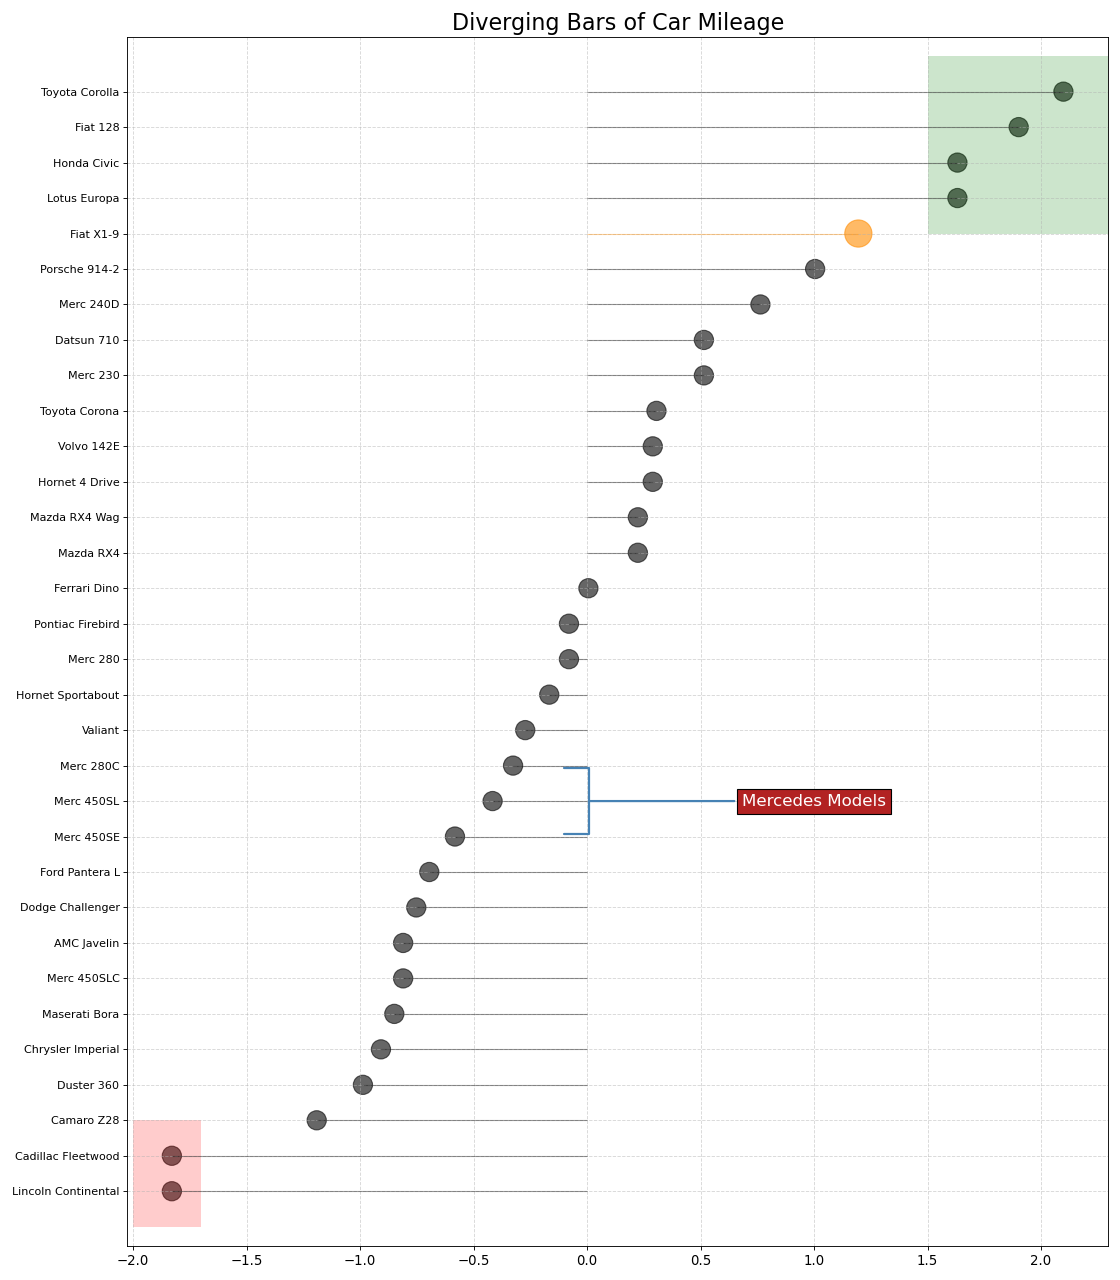
주의를 끌고자 하는 중요한 데이터 포인트를 강조하고 차트 내에서 적절하게 추론을 제공할 수 있다.
# 라이브러리 불러오기
import pandas as pd
import matplotlib.pyplot as plt
import matplotlib.patches as patches

# 데이터 가져오기 및 전처리
df = pd.read_csv("https://github.com/selva86/datasets/raw/master/mtcars.csv")
x = df.loc[:, ['mpg']]
df['mpg_z'] = (x - x.mean())/x.std()
df['colors'] = 'black'

# 색 변경
df.loc[df.cars == 'Fiat X1-9', 'colors'] = 'darkorange'
df.sort_values('mpg_z', inplace=True)
df.reset_index(inplace=True)

# 그래프 그리기
plt.figure(figsize=(14,16), dpi= 80)
plt.hlines(y=df.index, xmin=0, xmax=df.mpg_z, color=df.colors, alpha=0.4, linewidth=1)
plt.scatter(df.mpg_z, df.index, color=df.colors, s=[600 if x == 'Fiat X1-9' else 300 for x in df.cars], alpha=0.6)
plt.yticks(df.index, df.cars)
plt.xticks(fontsize=12)

# 주석 달기
plt.annotate('Mercedes Models', xy=(0.0, 11.0), xytext=(1.0, 11), xycoords='data',
            fontsize=15, ha='center', va='center',
            bbox=dict(boxstyle='square', fc='firebrick'),
            arrowprops=dict(arrowstyle='-[, widthB=2.0, lengthB=1.5', lw=2.0, color='steelblue'), color='white')

# 패치 추가
p1 = patches.Rectangle((-2.0, -1), width=.3, height=3, alpha=.2, facecolor='red')
p2 = patches.Rectangle((1.5, 27), width=.8, height=5, alpha=.2, facecolor='green')
plt.gca().add_patch(p1)
plt.gca().add_patch(p2)

# 그래프 꾸미기
plt.title('Diverging Bars of Car Mileage', fontdict={'size':20})
plt.grid(linestyle='--', alpha=0.5)
plt.tight_layout()
plt.savefig('diversing_dot.png')

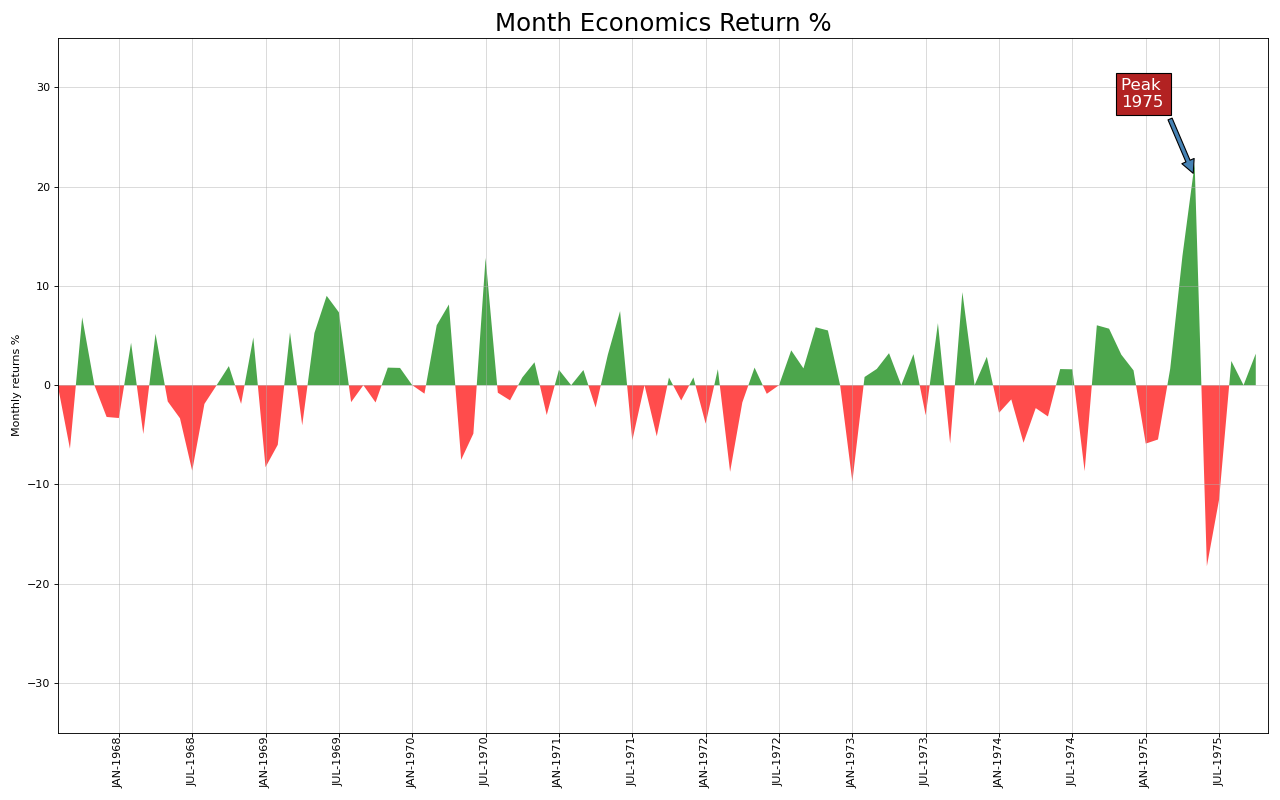
축과 선 사이의 영역을 색칠함으로써 고점과 저점뿐만 아니라 고점과 저점의 지속 시간을 더욱 강조할 수 있다. 고점의 지속 시간이 길수록 선 아래의 면적이 커진다.
# 라이브러리 불러오기
import numpy as np
import pandas as pd

# 데이터 가져오기 및 전처리
df = pd.read_csv("https://github.com/selva86/datasets/raw/master/economics.csv", parse_dates=['date']).head(100)
x = np.arange(df.shape[0])
y_returns = (df.psavert.diff().fillna(0)/df.psavert.shift(1)).fillna(0) * 100

# 그래프 그리기
plt.figure(figsize=(16,10), dpi= 80)
plt.fill_between(x[1:], y_returns[1:], 0, where=y_returns[1:] >= 0, facecolor='green', interpolate=True, alpha=0.7)
plt.fill_between(x[1:], y_returns[1:], 0, where=y_returns[1:] <= 0, facecolor='red', interpolate=True, alpha=0.7)

# 주석 달기
plt.annotate('Peak \n1975', xy=(94.0, 21.0), xytext=(88.0, 28),
            bbox=dict(boxstyle='square', fc='firebrick'),
            arrowprops=dict(facecolor='steelblue', shrink=0.05), fontsize=15, color='white')


# 그래프 꾸미기
xtickvals = [str(m)[:3].upper()+"-"+str(y) for y,m in zip(df.date.dt.year, df.date.dt.month_name())]
plt.gca().set_xticks(x[::6])
plt.gca().set_xticklabels(xtickvals[::6], rotation=90, fontdict={'horizontalalignment': 'center', 'verticalalignment': 'center_baseline'})
plt.ylim(-35,35)
plt.xlim(1,100)
plt.title("Month Economics Return %", fontsize=22)
plt.ylabel('Monthly returns %')
plt.grid(alpha=0.5)
plt.tight_layout()
plt.savefig('Area_chart.png')
