Python 프로그래밍 언어 및 수학적 확장 NumPy 라이브러리를 활용한 플로팅 라이브러리이다.
matplotlib.pyplot 모듈의 각각의 함수를 사용해서 간편하게 그래프를 만들고 변화를 줄 수 있다.
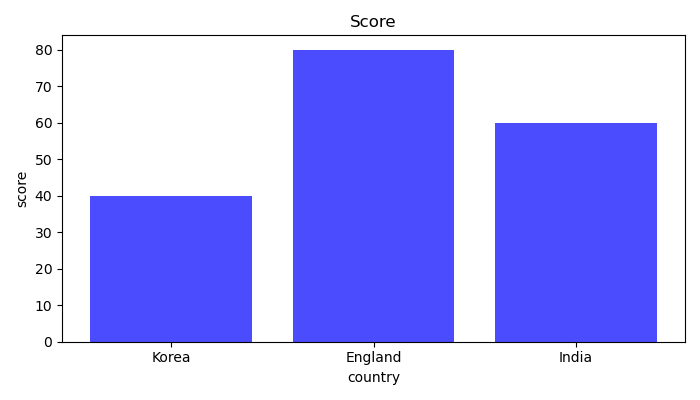
2-1-1. 코드
# 라이브러리 가져오기
import matplotlib.pyplot as plt

# 그래프로 그릴 데이터
x = ['Korea', 'England', 'India']
y = [40, 80, 60]

# 그래프 크기 지정
plt.figure(figsize = (7,4))

# barplot
plt.bar(x, y, alpha = 0.7, color = "blue")

# 그래프 제목
plt.title('Score')

# x label, y label
plt.xlabel('country')
plt.ylabel('score')

# 그래프 이미지로 저장
plt.tight_layout() # 여백 조정
plt.savefig('barplot.png') # barplot.png로 저장
2-1-2. 결과
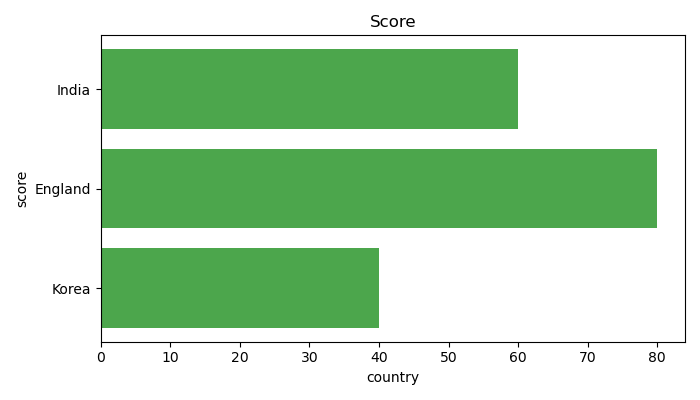
2-2-1. 코드
import matplotlib.pyplot as plt

# 그래프로 그릴 데이터
x = ['Korea', 'England', 'India']
y = [40, 80, 60]

# 그래프 크기 지정
plt.figure(figsize = (7,4))

# barhplot
plt.barh(x, y, alpha = 0.7, color = "green")

# 그래프 제목
plt.title('Score')

# x label, y label
plt.xlabel('country')
plt.ylabel('score')

# 그래프 이미지로 저장
plt.tight_layout() # 여백 조정
plt.savefig('barhplot.png') # barhplot.png로 저장
2-2-2. 결과